Understanding Heroku Logs
July 23, 2016
I’ve been using heroku for hosting my apps for free. However, free accounts on heroku are not provided with metrics.
Heroku logs provide a lot of information about about the app,
but searching them even with grep seems very tedious.
This post describes my attempt to parsing and
visualizing the server logs to make performance monitoring easier.
The Log Structure
While the heroku logs command gives a collection of different types of logs, the following structure is
common among them :
- Each new log is on a new line and has space separated elements.
- The first element is an ISO 8601 timestamp with nanosecond precision.
- The second element is the source process of the log.
- Everything after the second element is the content of the log.
[timestamp] [source] [key1]=[value1] ...
On the basis of the content of the log, it can be classified into the following major categories :
- Log about an incoming request. It contains the HTTP Verb, the request URL and the time taken by the server to send a response in milliseconds
- Log about memory consumtion of the app. Information about swap and cache use, total memory use and number of pages read and written.
- Log about average load. Load averages at 1 minute, 5 minutes and 15 minutes.
- Miscellaneous Log. Logs from the app etc.
Parsing
Next I got to parsing. Following is the python 2.7 script I used to parse the logs and convert them to json.
Here, I used the shlex module which makes it very convinient to read quoted strings.
#!/usr/bin/env python
import sys, json, shlex

InFileName = sys.argv[1]
OutFileName = sys.argv[2]
SourceProcess = sys.argv[3]

parsedData = list()

with open(InFileName) as infile:
  for line in infile:
    source = line.strip().split()[1]
    if source.startswith(SourceProcess) and '=' in line and 'memory' in line:

      # split on space preserving quoted substrings
      tokens = shlex.split(line)

      # ["key1=value1","key2=value2"] to {key1: value1, key2: value2}
      pairs = dict([tuple(token.split('=')) for token in tokens[2:]])

      pairs['timestamp'] = tokens[0]

      parsedData.append(pairs)

with open(OutFileName, 'w') as outfile:
  json.dump(parsedData, outfile)
Visualisation
The json generated by the parsing script can be loaded directly as a pandas DataFrame.
| memory_cache | memory_pgpgin | memory_pgpgout | memory_quota | memory_rss | memory_swap | memory_total |
|---|---|---|---|---|---|---|
| 0.00MB | 1332855pages | 1331345pages | 512.00MB | 153.61MB | 4.70MB | 158.31MB |
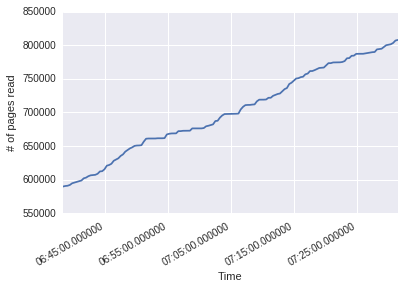
Using matplotlib and seaborn, I was able to generate the following visualizations.
They can be interpreted as per the descriptions on heroku: https://devcenter.heroku.com/articles/metrics
Also, using plt.gcf().autofmt_xdate() when plotting time series data makes the time readable.
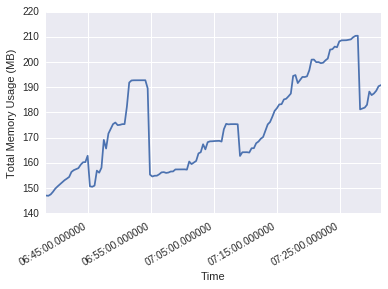
Total memory consumed over time
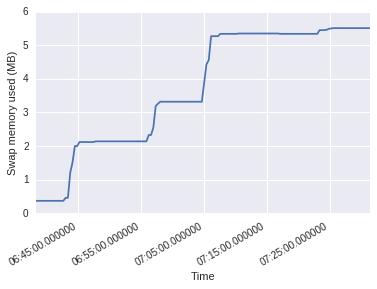
Swap Memory usage over time
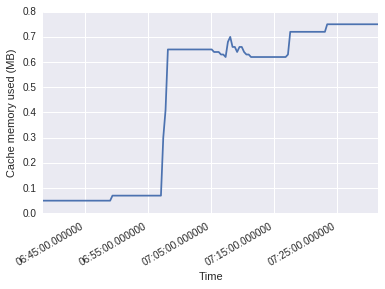
Cache Memory usage over time
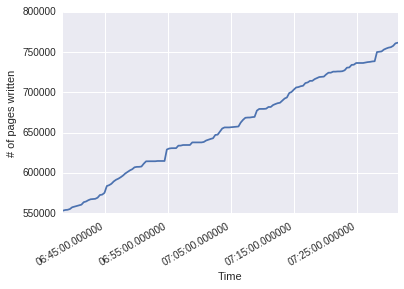
Pages read over time
Pages written over time